World
Showing 1–30 of 218 results
-

CO2 emissions per capita per year (tons), 2018

GDP (million constant 2015 $), 2019

Fragile States Index, evolution 2010-2020

Share of female students in primary education (%), 2010-2015

Population (thousands people), 2020
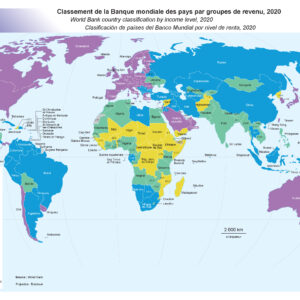
World Bank country classification by income level, 2020

CO2 emissions (kt), 2018

Health expenditure per capita (current US$), 2014

Life expectancy at birth (years), 2008 and 2018

Population density (inhab. per km2), 2018

Access to electricity (% of population), 2010

Access to electricity (% of population), 2018

Adult literacy rate, 2015

Agricultural land (% of land area), 2014

Agricultural land (% of land area), 2020

Agricultural land (km2), 2018

Agriculture (% of GDP), 2014-2018

Agriculture (% of GDP), 2021

Annual freshwater withdrawals (billion m3), 2019

Annual mean concentration of fine particulate matter PM2.5 (μg/m3), 2019

Annual mean concentration of fine particulate matter PM2.5 (μg/m3), 2019

Arable land (% of land area), 2014

Arable land (% of land area), 2020

Birth rate crude, 2019

Birth rate crude, 2019

Birth rate, crude, 2014

Cereal yield (kg per hectare), 2014

Cereal yield (kg per hectare), 2020

Clean water (% of population with access), 2018-2022

CO2 emissions (kt), 1998
show blocks helperTHÈMES et INDICATEURSTHEMES and INDICATORSTEMAS e INDICADORES
ANNÉESYEARSAÑOS
CARTES DE TAUX
(Traitement de l'indicateur)RATE MAPS
(Indicator processing)MAPAS DE TASAS
(tratamiento del indicador)CARTES DE STOCKSMAPS OF STOCK INDICATORSMAPAS DE EXISTENCIAS
CARTES DE DONNÉES QUALITATIVESQUALITATIVE DATA MAPSMAPAS DE DATOS CUALITATIVOS