Maps
-

*CO2 emissions (kt), 2008

CO2 emissions per capita per year (tons), 2018

GDP (million constant 2015 $), 2019

Fragile States Index, evolution 2010-2020

Electric power consumption (KWh per capita), 2014

Share of female students in primary education (%), 2010-2015

Population (thousands people), 2020

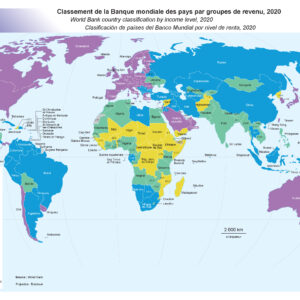
World Bank country classification by income level, 2020

Gross fixed capital formation (million current $), 2020

CO2 emissions (kt), 2018

GDP (million constant 2015 $), 2019

Health expenditure per capita (current US$), 2014

Human Development Index (HDI), 2018

Life expectancy at birth (years), 2008 and 2018

Agricultural land (km2), 2018

Forest area (hectares), 2019

Fertilizer consumption (kg per hectare), 2014

CO2 emissions (kt), 2018

Network Readiness Index, 2014-2016

Natural resources rents (% of GDP), 2015-2016

Labor force participation rate, female (% of female population ages 15+), 2014

Population density (inhab. per km2), 2018

Access to electricity (% of population), 2010

Access to electricity (% of population), 2010

Access to electricity (% of population), 2018

Access to electricity (% of population), 2018

Access to electricity (% of population), 2018

Access to electricity (% of population), 2019

Access to electricity (% of population), 2020
Manage consentPrivacy Overview
This website uses cookies to improve your experience while you navigate through the website. Out of these, the cookies that are categorized as necessary are stored on your browser as they are essential for the working of basic functionalities of the website. We also use third-party cookies that help us analyze and understand how you use this website. These cookies will be stored in your browser only with your consent. You also have the option to opt-out of these cookies. But opting out of some of these cookies may affect your browsing experience.

